Dashboard
Overview
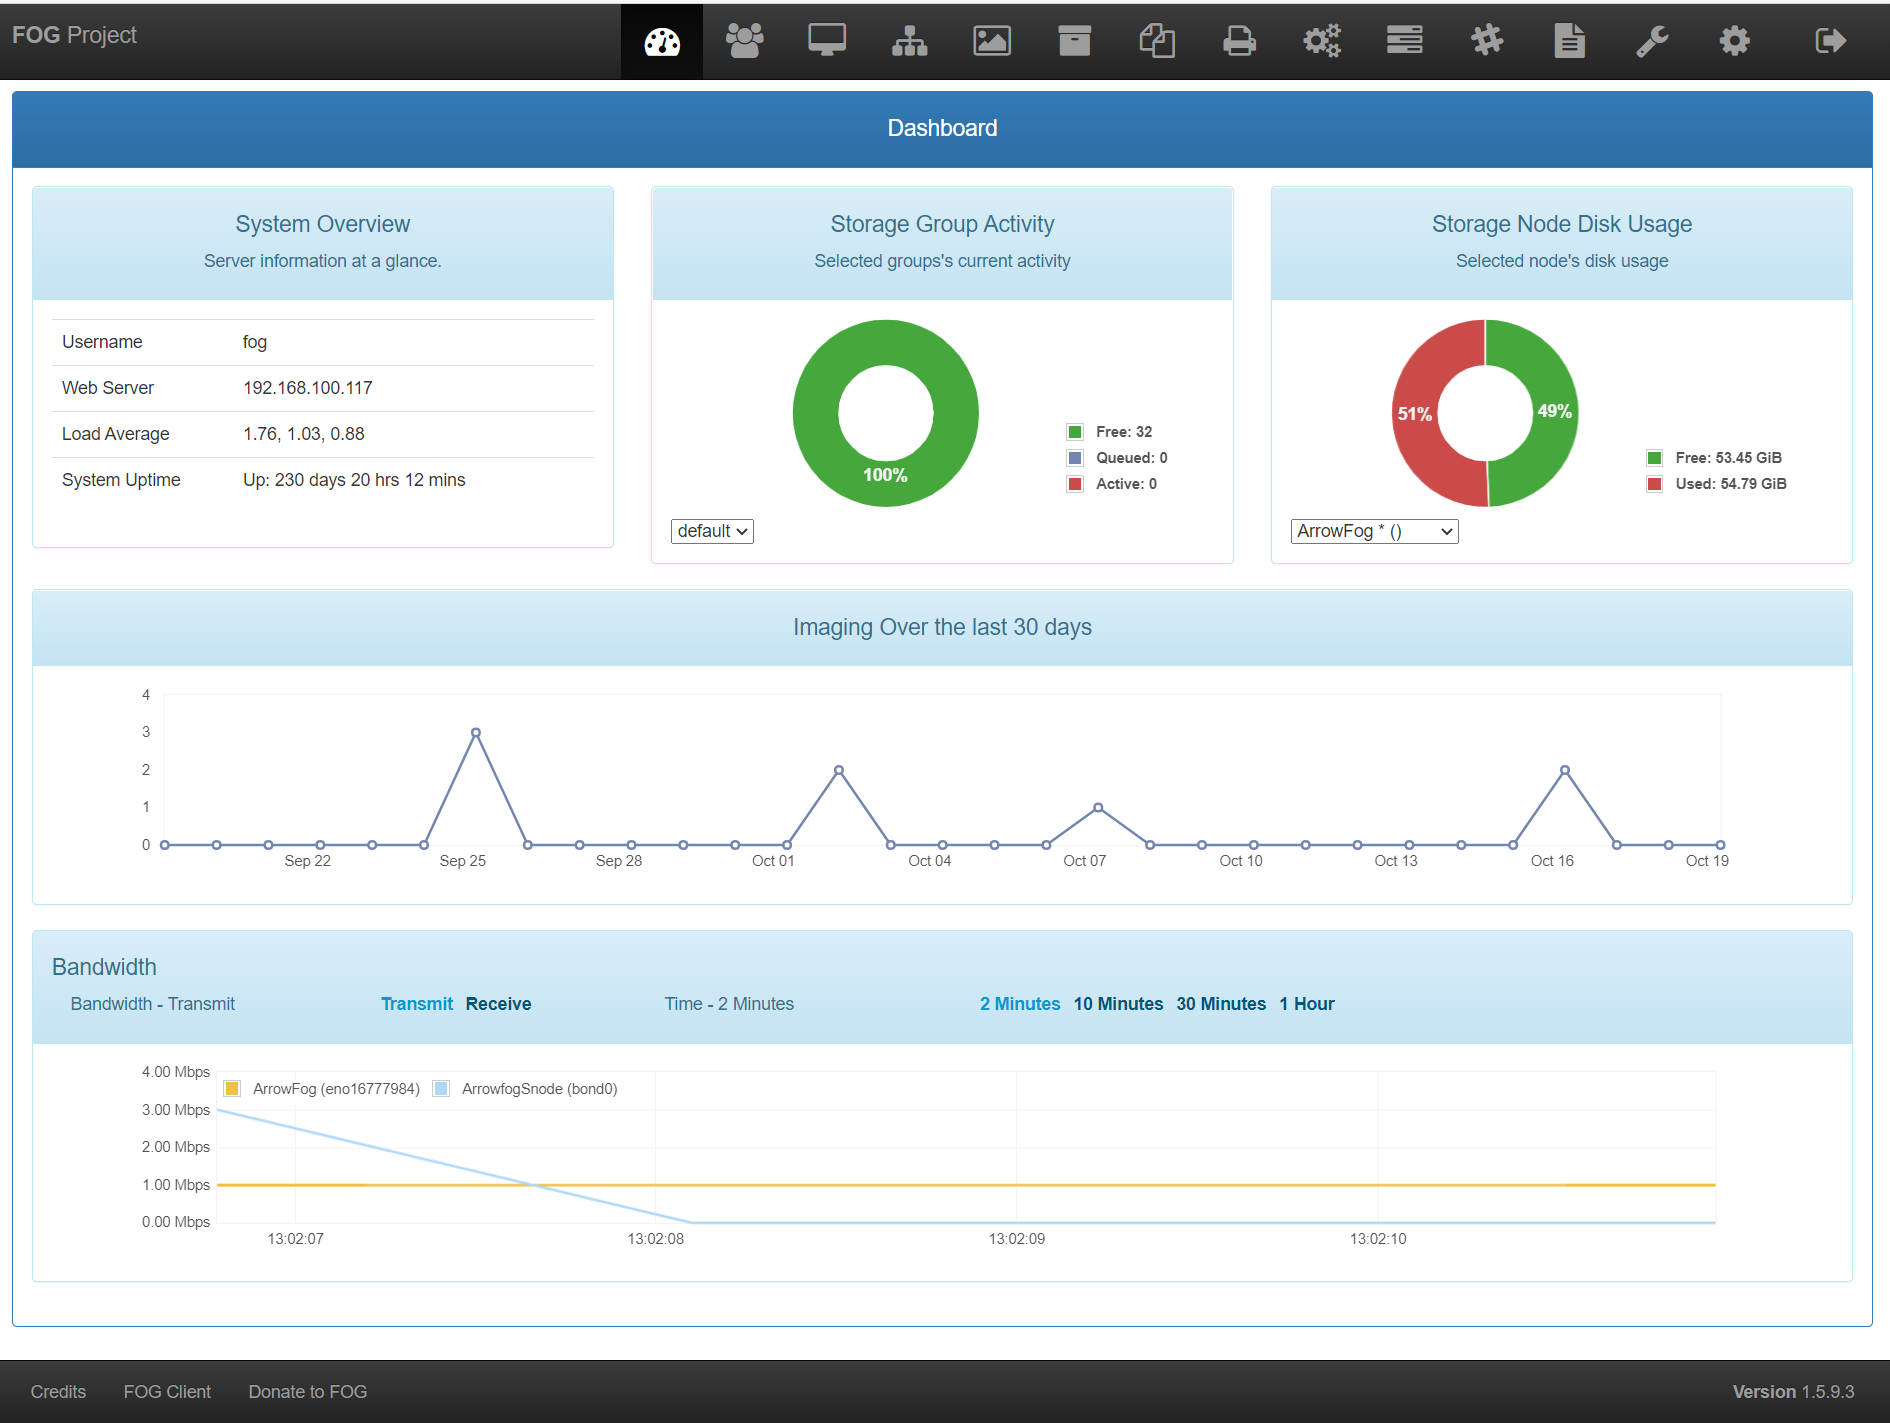
The FOG dashboard is the first page you are presented with after login.
This page just gives you an overview of what is happening on your FOG server.
System overview
The system overview box is the the top left hand box on this page.
The information presented in this box is
the current user
the server IP addresses or hostnames for your web server
the server IP addresses or hostnames for your tftp server
the server IP addresses or hostnames for your storage server
This section also gives you the system uptime or how long the system has been running without restart
The system load
System Activity
The system activity box is in the top row, the middle box.
- This section shows the unicast queue, or the number of unicast deploys that are currently in progress.
The queue size can change and is based on the the Storage Group(s).
- Each storage node has a setting ‘’Max Clients’’ making this the maximum number of hosts that this node can image to.
If there are 2 nodes with a max of 10 each then your maximum queue amount is 20.
However, remember the more you increase the ‘’Max Clients’’ the slower each particular host will be to deploy the image.
This means that after 20 hosts are receiving images (at once) the 21st will wait for one of the hosts in progress to complete before starting.
The reason this was created was so that you could queue up 100 machines with different images (all unicast) and still keep the system functional.
We have heard of this queue being used to re-image an entire building of computers ( ~ 1000+ ) overnight.
This section updates in real time.
It will display all the queued, running, etc… tasks and updates at the same interval as the Bandwidth graph.
- Also, SVN installations (and later future releases) are able to edit which type of tasks get counted towards the “queue”.
This edit can be performed by going to FOGConfiguration
 –> FOG Settings–> General Settings –> FOG_USED_TASKS.
The text field is numeric values (so you’ll need to know which task id’s are which type.
This text field is a CSV setup. If you type (1,2,3,4,5) it will display all tasks of Deploy, Capture, Debug, Memtest, and Testdisk as queued/active depending on their current state.
The exception to this rule, is Task Type ID 8 (multicast) in which case it takes the Jobs, not each individual host task, as a queued slot.
Disk Information
The disk information box is the top, right hand section of the dashboard page.
This is a semi-realtime display of the storage remaining on the storage server.
There is also a drop-down box that can be changed to your storage nodes to monitor their Disk Information.
If you get an error in this box, please see [[Dashboard Error: Permission denied…]] #page doesn’t exist in rst yet
30 Day Imaging History
This image shows your imaging trends for the past 30 days
Menu Bar

This menu appears at the top of every page on Fog’s web UI. The icons are, from left to right:
 Home/Dashboard - This is the home screen of the FOG management portal.
 User Management - Individual administrators of the FOG resources.
 Host Management - This section houses the hosts, which are the pcs to be imaged or to extract images from.
 Group Management - This section houses groups, which are similar PCS’ that need tasks done en-masse.
 Image Management - This section allows you to manage the image files stored on the FOG server.
 Storage Node Management - This section allows you to add/remove storage nodes from the FOG system.
 Snapin Management - This section provides ways to automate various post-imaging tasks, not covered in this refument
 Printer Management - This section allows for management of printers, allowing you create printer objects that can later be assigned to hosts or groups.
 Fog Service (aka Client) Management - This section allows you to control how the client service functions.
 Task Management - This section allow you to perform imaging tasks such as acquiring or deploying images.
 Report Management - Reports let you pull information from the FOG database either as HTML, pdf, or csv.
- Fog Configuration - The section has the rest of the settings that don’t fit anywhere else like the kernel updater, client service updater, iPXE edits, MAC address list, Log viewer
 Plugins - Plugins add more functionality to FOG. Must be enabled in Fog Configuration
 Logoff - Click this to log off of the Fog web UI