
Report Management
Overview
A report answers a question about your FOG server that no single record page can. Host Management can tell you about one host; the Fleet Report tells you how many of your hosts have never been imaged. Task Management shows you the tasks; the Imaging Report shows you how much imaging actually happened last month and which images did it.
Reports live under Reports  in the main menu, and
each one is a page of its own in the left-hand list.
in the main menu, and
each one is a page of its own in the left-hand list.

FOG 1.6
This page describes FOG 1.6. FOG 1.5 has no Reports/Lists split, no date window, and no CSV (All) — a single flat, alphabetical menu instead. See the 1.5 version of this page.
FOG 1.6 splits that list into two groups, because there are genuinely two different kinds of screen behind it:
| Group | What you get | Why it exists |
|---|---|---|
| Reports | A date range, headline numbers, charts, and a table underneath | To measure something over a period — “how much”, “how many”, “is this getting better” |
| Lists | A table | To pull a set of records out of FOG, usually to hand to something else |
Both kinds export to CSV. Only the Reports group has a date window, because only that group is answering a question about a period of time.
Note
Which reports you see depends on your permissions, and on which plugins are installed. See Who can see which report below.
The reports
These aggregate — they count, group, and chart. Each opens on a sensible default range so it shows you something useful before you touch anything.
| Report | Answers | Opens on |
|---|---|---|
| Fleet Report | How current the fleet is, and which machines have fallen behind | Last 90 days |
| Imaging Report | How much imaging happened, of what, and to how many machines | Last 30 days |
| Snapin Report | Which snapins ran, where, and whether they worked | Last 30 days |
| Hardware Report | What hardware the fleet is actually made of | Last 90 days |
| Storage Report | How much the image estate weighs, and where it is meant to live | Last 365 days |
| Run History | What ran, and when it started and finished | Last 24 hours |
| Audit Report | Who changed what, who was refused, and when | Last 30 days |
The lists
These are row dumps. No window, no charts — a table you can sort, filter and export.
| List | Contains |
|---|---|
| Full History | Every history entry FOG has recorded |
| User Logins | Hosts and the users who have logged into them |
| Snapin List | Every snapin, its file and its arguments |
| Host Product Keys | Each host’s stored Windows product key |
| Pending MAC Addresses | MAC addresses awaiting approval |
| Files Deleted List | What the File Deleter service has removed |
The date window
Every report in the Reports group carries the same control: a From date, a To date, and a Show button.

The range lives in the page’s own URL, which has two practical consequences worth knowing:
- A report you have set up is a bookmarkable link. Set the dates, press Show, then bookmark or paste the address. Anyone who opens it sees the same range.
- The CSV export follows the window. Exporting after narrowing the dates exports the narrowed set, not everything.
A few details that stop the window surprising you:
- Dates are read on the FOG server’s configured timezone
(
FOG_TZ), not your browser’s and not PHP’s. A task created seconds ago appears in a window ending “now” even if the two clocks differ. - Typing the dates the wrong way round is fine — FOG swaps them.
- An unreadable date is ignored, and the report falls back to its default range. A mistyped URL shows you the default, not an empty table.
Important
The Fleet Report reads the window differently, and says so on the page. Everywhere else the window selects events — things that happened between two dates. Staleness is not an event: a machine that did nothing at all in the window is exactly the machine the Fleet Report is about. So there, the To date is an as-of date and the From date is what counts as current. A host imaged inside the range is up to date; everything else is measured back from the end date.
Reading a report
A report page is three things stacked, and they are meant to be read in that order.
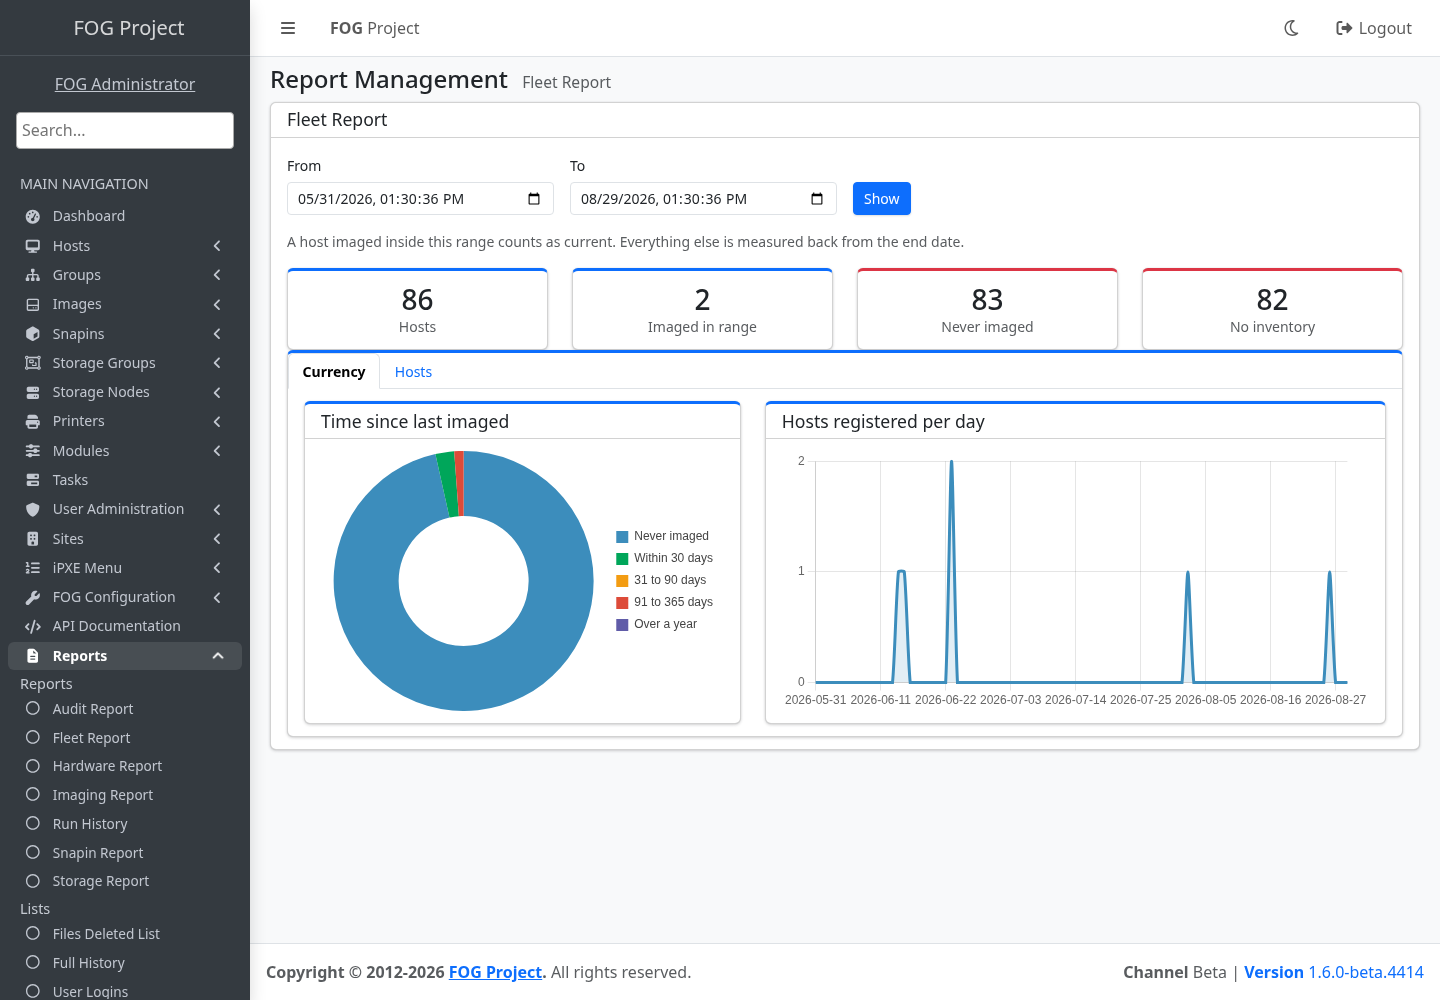
- The tiles are the headline numbers for the range. The Fleet Report’s are Hosts, Imaged in range, Never imaged and No inventory; the Imaging Report’s are Imaging runs, Machines imaged, Images used and Runs per day. A tile shown in a warning color is one you are probably meant to act on.
- The charts show the shape over time, or the breakdown. They are grouped into tabs when a report has more than one thing worth charting — the Fleet Report has Currency, the Hardware Report has Make and model, Capability and Freshness.
- The table is the underlying rows, sorted so the rows you have to act on are at the top. The Fleet Report’s host list is ordered stalest first, with never-imaged machines leading.
Tip
“Never” is its own answer, not a very large age. A host that has never been imaged and one imaged three years ago are different problems, and the Fleet Report counts them separately rather than bucketing them together.
Exporting
Every report table carries the same toolbar.
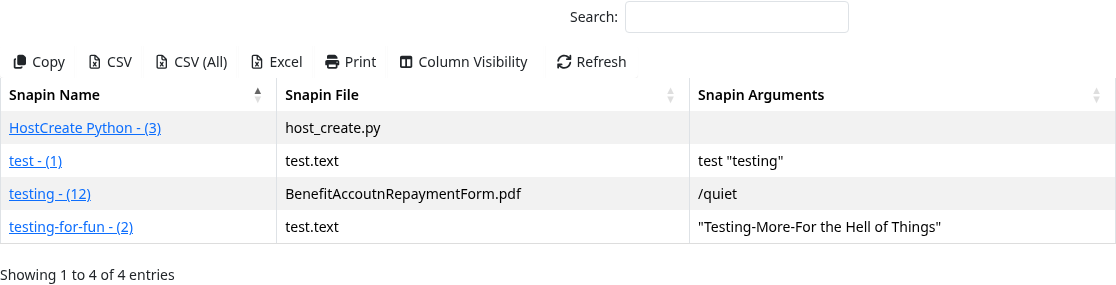
| Button | Exports |
|---|---|
| Copy | The rows currently on screen, to the clipboard |
| CSV | The rows currently on screen |
| CSV (All) | Every row the report returns for this range |
| Excel | The rows currently on screen |
| The rows currently on screen | |
| Column Visibility | (not an export — hides and shows columns) |
| Refresh | (not an export — re-runs the query) |
The distinction between CSV and CSV (All) is the one that matters and it is not cosmetic. Report tables are paged on the server: your browser only ever holds the page you are looking at. Copy, CSV, Excel and Print can only see what the browser holds, so on a 25-row page they give you 25 rows — even if the report matched 4,000. CSV (All), which sits directly beside CSV for exactly that reason, asks the server for the whole result set instead.
CSV (All) carries your current view with it:
- the search box — search first and the file contains only matches;
- the sort — the file arrives in the order you are looking at;
- the columns you have visible, in the order you have them, with the on-screen headings as the CSV headings.
Note
Host Product Keys has no CSV (All) button, deliberately. The report masks the keys on screen; a bulk export of the unmasked values is the one thing it exists to avoid handing out.
When a report is bigger than the cap
Every report is capped, so that one query cannot take the server down:
| Group | Cap |
|---|---|
| Reports | 5,000 rows |
| Lists | 10,000 rows |
Past that, a report in the Reports group shows a banner above the numbers saying so and telling you to narrow the dates.
That banner is not only about the table. Every tile and every chart on these pages is computed from the same rows, so a silent cap would make the headline numbers quietly wrong on exactly the busy fleets that most need them right.
Two things follow from it:
- Narrow the range to get exact figures. Two halves of a year, run separately, will each come in under the cap where the whole year did not.
- A capped export says so in its own filename. The download comes
back named something like
imaging-report-2026-08-29-first-5000.csv, orfull-history-2026-08-29-first-10000-of-41328.csvwhere FOG knows the true total — so a truncated file cannot be mistaken for a complete one later.
Note
The Fleet Report’s Hosts tile is a true count of your whole fleet even when the table below it is capped — it is asked of the database directly, so a site with 12,000 hosts is not told it has exactly 10,000.
Who can see which report
A report is gated on the permission for the data it reads, not on a blanket “reports” permission. Someone who cannot see tasks in Task Management cannot read them through the Imaging Report either.
| Report | Requires |
|---|---|
| Fleet Report, Hardware Report | host.view |
| Imaging Report, Run History | task.view |
| Snapin Report | snapin.view |
| Storage Report | storagenode.view |
| Audit Report | audit.view |
| User Logins | usertracking.view |
| Everything else | report.view |
The Audit Report’s separation is the one to be deliberate about: an audit
row necessarily discloses attempted usernames, so it has a permission of
its own rather than riding on report.view.
Reports that come from plugins
Several bundled plugins add a report of their own to the Lists group — Export OUs, Export LDAP Servers, Export Locations, Export Windows Keys, Export WOL Broadcasts, Export Subnet Groups, Export Task States and Export Task Types. They appear only when the plugin is installed, and they behave like any other list.
If you are writing a plugin, see the REPORT_TITLE_DATA event in
docs/plugin-development.md in the fogproject repository — it is how a
plugin names its report in the menu instead of having FOG guess a label
from the file name.
Installing a report someone else wrote
There is no Import Reports page. Earlier FOG showed one, but nothing was ever wired behind its button — it answered without an error and imported nothing — so 1.6 removes it rather than completing it.
Danger
A FOG report is PHP that runs on your server. It has the same access to your system and your database that FOG itself does — it can read anything, change anything, and delete anything. This is why there is no one-click importer for a loose
.phpfile, and why the route below has two switches an administrator has to throw deliberately.
A report from someone else arrives as a plugin, which is FOG’s one supported way to add code to a running server:
- The report ships inside the plugin at
<plugin>/src/Reports/, exactly as described under Writing a report below. - Install the plugin — either by unpacking it into the plugin directory on the server, or through Plugin Management → Upload plugin.
The upload route is off by default and takes both
FOG_PLUGIN_UI_INSTALL_ENABLED and a root-run
bin/fog-plugin-uploads.sh enable to turn on. It stages the archive
somewhere FOG does not execute it and shows you the manifest, the file
list and a SHA-256 before anything is installed.
See Installing a plugin from an archive
for the whole sequence.
The report appears in the left-hand menu as soon as the plugin is installed.
Writing a report
A report is one PHP file in packages/web/src/Reports/, named exactly
after the class it declares. Fleet_Report.php declares Fleet_Report;
the menu entry, the class name and the file name all have to agree,
because FOG resolves the class from the file’s path.
Keep the underscores. The menu label, the base64 f parameter in the
report’s URL and the permission node are all derived from the file name
with underscores turned into spaces and the whole thing lowercased — so
Fleet_Report is “fleet report” in all three. Renaming it FleetReport
moves the report to a different URL under a different permission node.
A report needs two methods:
file()draws the page — the heading, any window control, tiles or charts, and the table’s shell.reportRows()returns the rows. The on-screen grid and the CSV (All) export both call it, which is what stops the two disagreeing.
A minimal list report:
<?php

namespace FOG\Reports;

use FOG\Router\Route;

class Example_Report extends \FOG\Pages\ReportManagement
{
    public function file()
    {
        $this->title = self::reportTitle();

        $this->headerData = [
            _('Host Name'),
            _('Description')
        ];
        $this->attributes = [[], []];

        echo '<div class="card">';
        echo '<div class="card-header">';
        echo '<h4 class="card-title">' . $this->title . '</h4>';
        echo '</div>';
        echo '<div class="card-body">';
        echo $this->render(12, 'examplereport-table');
        echo '</div>';
        echo '</div>';
    }

    protected function reportRows()
    {
        Route::listem('host');

        return (array) json_decode(Route::getData(), true);
    }
}
A report is found by its path, not by its filename, so where it sits
and what it declares are the same fact written twice. A core report at
packages/web/src/Reports/Example_Report.php declares namespace FOG\Reports;.
A report shipped inside a plugin is the same shape with a different
root: <plugin>/src/Reports/Example_Report.php declares namespace FOG\Plugins\<Segment>\Reports;. Nothing else about it changes, and it
needs no class_alias() — see the plugin development guide.
The table is wired up in JavaScript, which for a plugin lives in the
plugin’s own js/ directory and for a standalone report can be echoed
inline from file():
$('#examplereport-table').registerReportTable(
  [
    {data: 'name'},
    {data: 'description'}
  ],
  {fullExport: true}
);
fullExport: true is what adds the CSV (All) button. It is opt-in
because the button posts to a different endpoint — a report that has not
been written against reportRows() would answer it with an empty file
rather than an error.
Note
Reports in FOG 0.32 and 1.2 were written against a
ReportMakerclass and rawmysql_*calls, and could emit PDF. None of that exists in 1.6. If you are carrying an old custom report forward, it needs rewriting to the shape above rather than porting.